Eadon Jacobs, Product
Over the past year, most of the discussion around AI in engineering has focused on speed. How many more pull requests are being shipped? How much faster are developers moving? How long are code reviews happening?
In January, we shared some early findings based on 12 months of data, alongside the launch of the AI Impact Report inside Span. We observed that developers using AI shipped roughly 67 percent more pull requests per week, while rework time increased by about 30 percent on average.
Those metrics tell us how fast code moves. They do not tell us how well it holds up.
What remains harder to answer is a more fundamental question: what is happening to quality?
Measuring quality across the lifecycle
Quality is not difficult to observe in isolated moments. Teams can see production incidents. They can track bug tickets or run static analysis tools.
What is harder is creating the right metrics that connect shipped code to downstream correction in a consistent, comparable way. If you want to understand whether AI-shaped work behaves differently from mostly human-written work, you need a measure that ties introduction to resolution over time.
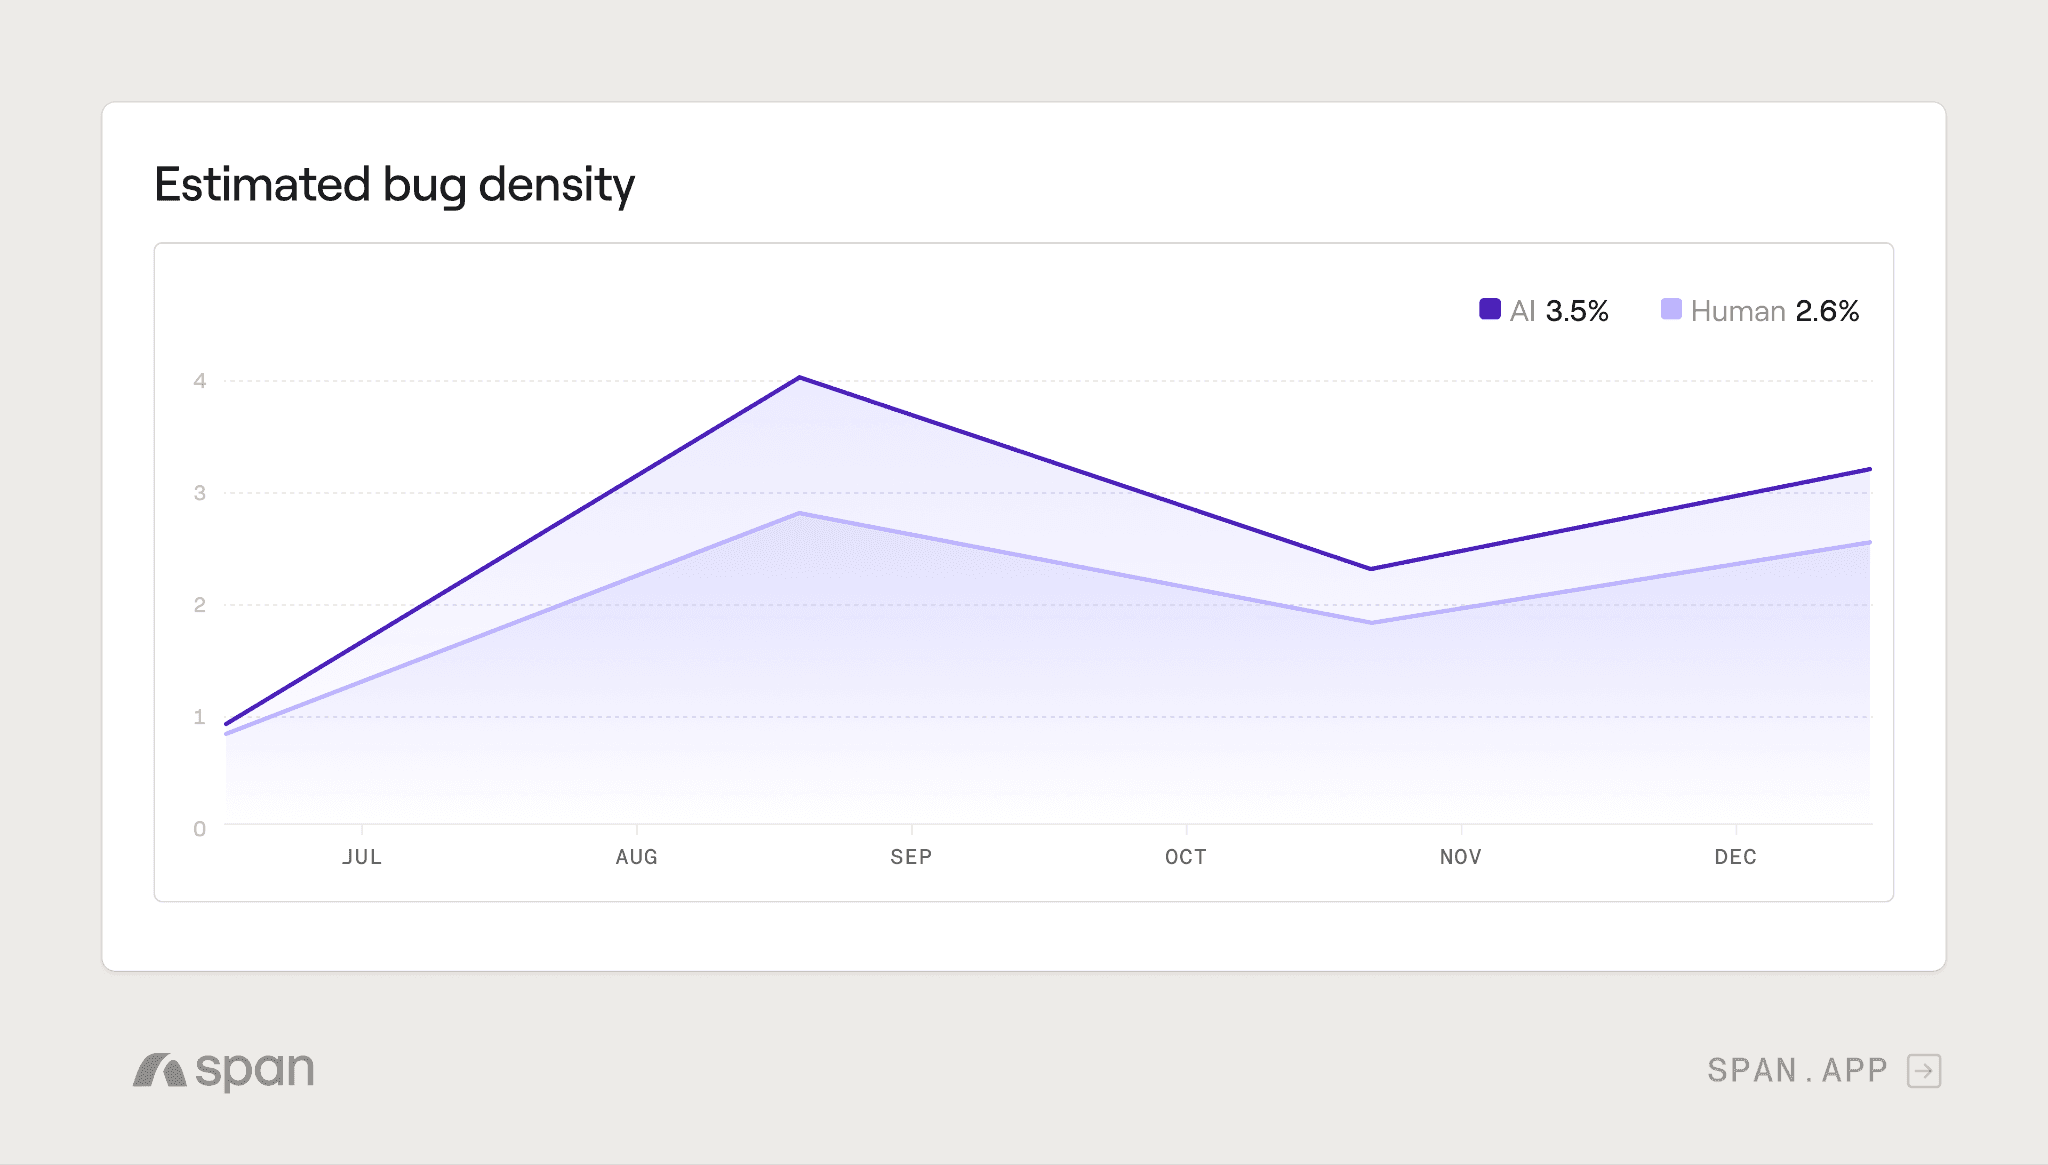
Estimated bug density is designed to provide that signal.
At a high level, the metric:
Identifies pull requests that fix bugs
Looks up to 90 days back to link those fixes back to the pull request that likely introduced the issue
Measures the relative rate at which merged work results in follow-on defect fixes
By anchoring the analysis in PR activity and linking introduction to correction within a defined window, it provides a normalized view of how often shipped work turns into additional corrective work.
What we are seeing so far
Across an initial set of customers, we are seeing a consistent early pattern.
When comparing pull requests that are almost entirely human-written (0-5% AI) to those with AI-generated code, estimated bug density tends to be higher in the AI-heavy group.
For most organizations the difference is meaningful, with AI-generated PRs introducing bugs at a 32—50% higher rate than primarily human-written PRs.
For leading organizations, that gap was smaller—around 10—11%.
This is an early signal, not a generalized research claim. As AI usage increases within a PR, the likelihood that it results in a downstream bug-fix within 90 days often increases as well.
In one deeper analysis, one team merged PRs roughly 4—5% faster and reduced review cycles by about 19%. At the same time, the rate at which merged PRs required follow-on bug fixes within 90 days increased by 59%.
The front of the pipeline improved, but downstream correction work increased materially.
Without a lifecycle metric, that tradeoff would have been easy to miss.
Where to start if quality strain grows
If defects start to increase alongside AI adoption, the goal is typically not to slow down AI usage. More often, it is to adjust the surrounding system.
Some starting points to consider include:
Adopting AI code review solutions and configuring with custom rules
Clarifying architectural guidance and agent instructions (.md files) so generated code adheres more closely to internal patterns
Enforcing architectural layers with import linters to prevent forbidden imports
Looking for patterns in code review comments and creating custom skills to shift left
Encouraging a culture of making PRs easier to review, even if they are AI-assisted
Encouraging self-review with custom skills for code review
In practice, teams that evolve their review and testing standards alongside AI adoption tend to sustain throughput gains without accumulating excess correction work.
Completing the picture
Adoption tells you how much AI is being used. Throughput tells you how quickly code is moving. Estimated bug density helps you keep your team in check.
AI transformation is a systems problem. Optimizing a single stage can create the appearance of improvement while shifting cost elsewhere in the lifecycle. Measuring introduction and correction within a defined window provides a clearer view of system health.
Estimated bug density is now rolling out more broadly to Span customers. We are working closely with customers to interpret these signals and highlight where to focus next, from review practices to testing guardrails.
If you are already tracking AI adoption and throughput, the missing piece is quality. Measuring is the first step. Strengthening the system based on that signal is where the real leverage comes from.